Machine Learning-Based Clock Domain Crossing Data Clustering & Classification
SSO Symposium Presentation by Youngchan Lee of Samsung
Overview
Youngchan Lee of Samsung presented at Real Intent’s 2023 Static Sign-Off Symposium. He covered Samsung’s successful machine learning-based CDC classification and clustering experiment, with a goal to reduce engineering time through waiver reuse. Samsung developed machine learning models and used them with Real Intent Meridian CDC.
Below is a lightly edited transcript of what he presented.
CDC Sign-off Challenges in SOC Design
Samsung has successfully implemented machine learning-based clock domain crossing (CDC) verification, achieving meaningful results. We used our ML models with Real Intent Meridian CDC.
This graphic shows the yearly trend of our designs — and the growing number of CDC paths.
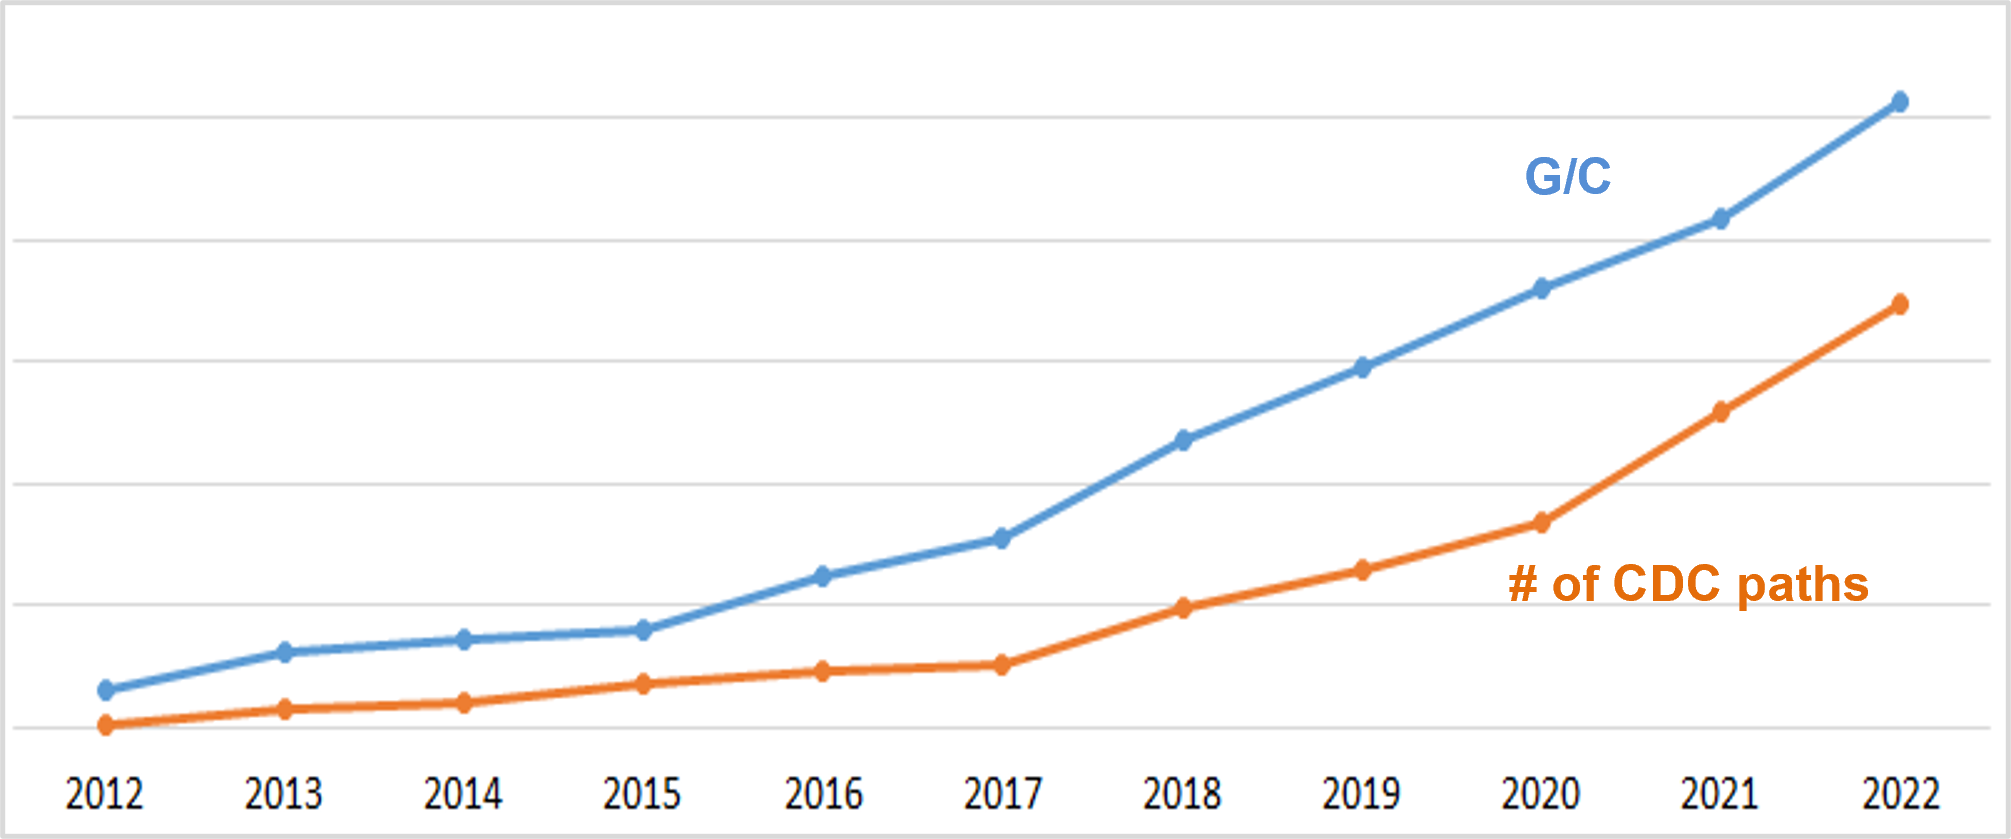
Equivalent nand2 G/C for premium SOC (digital portion only)
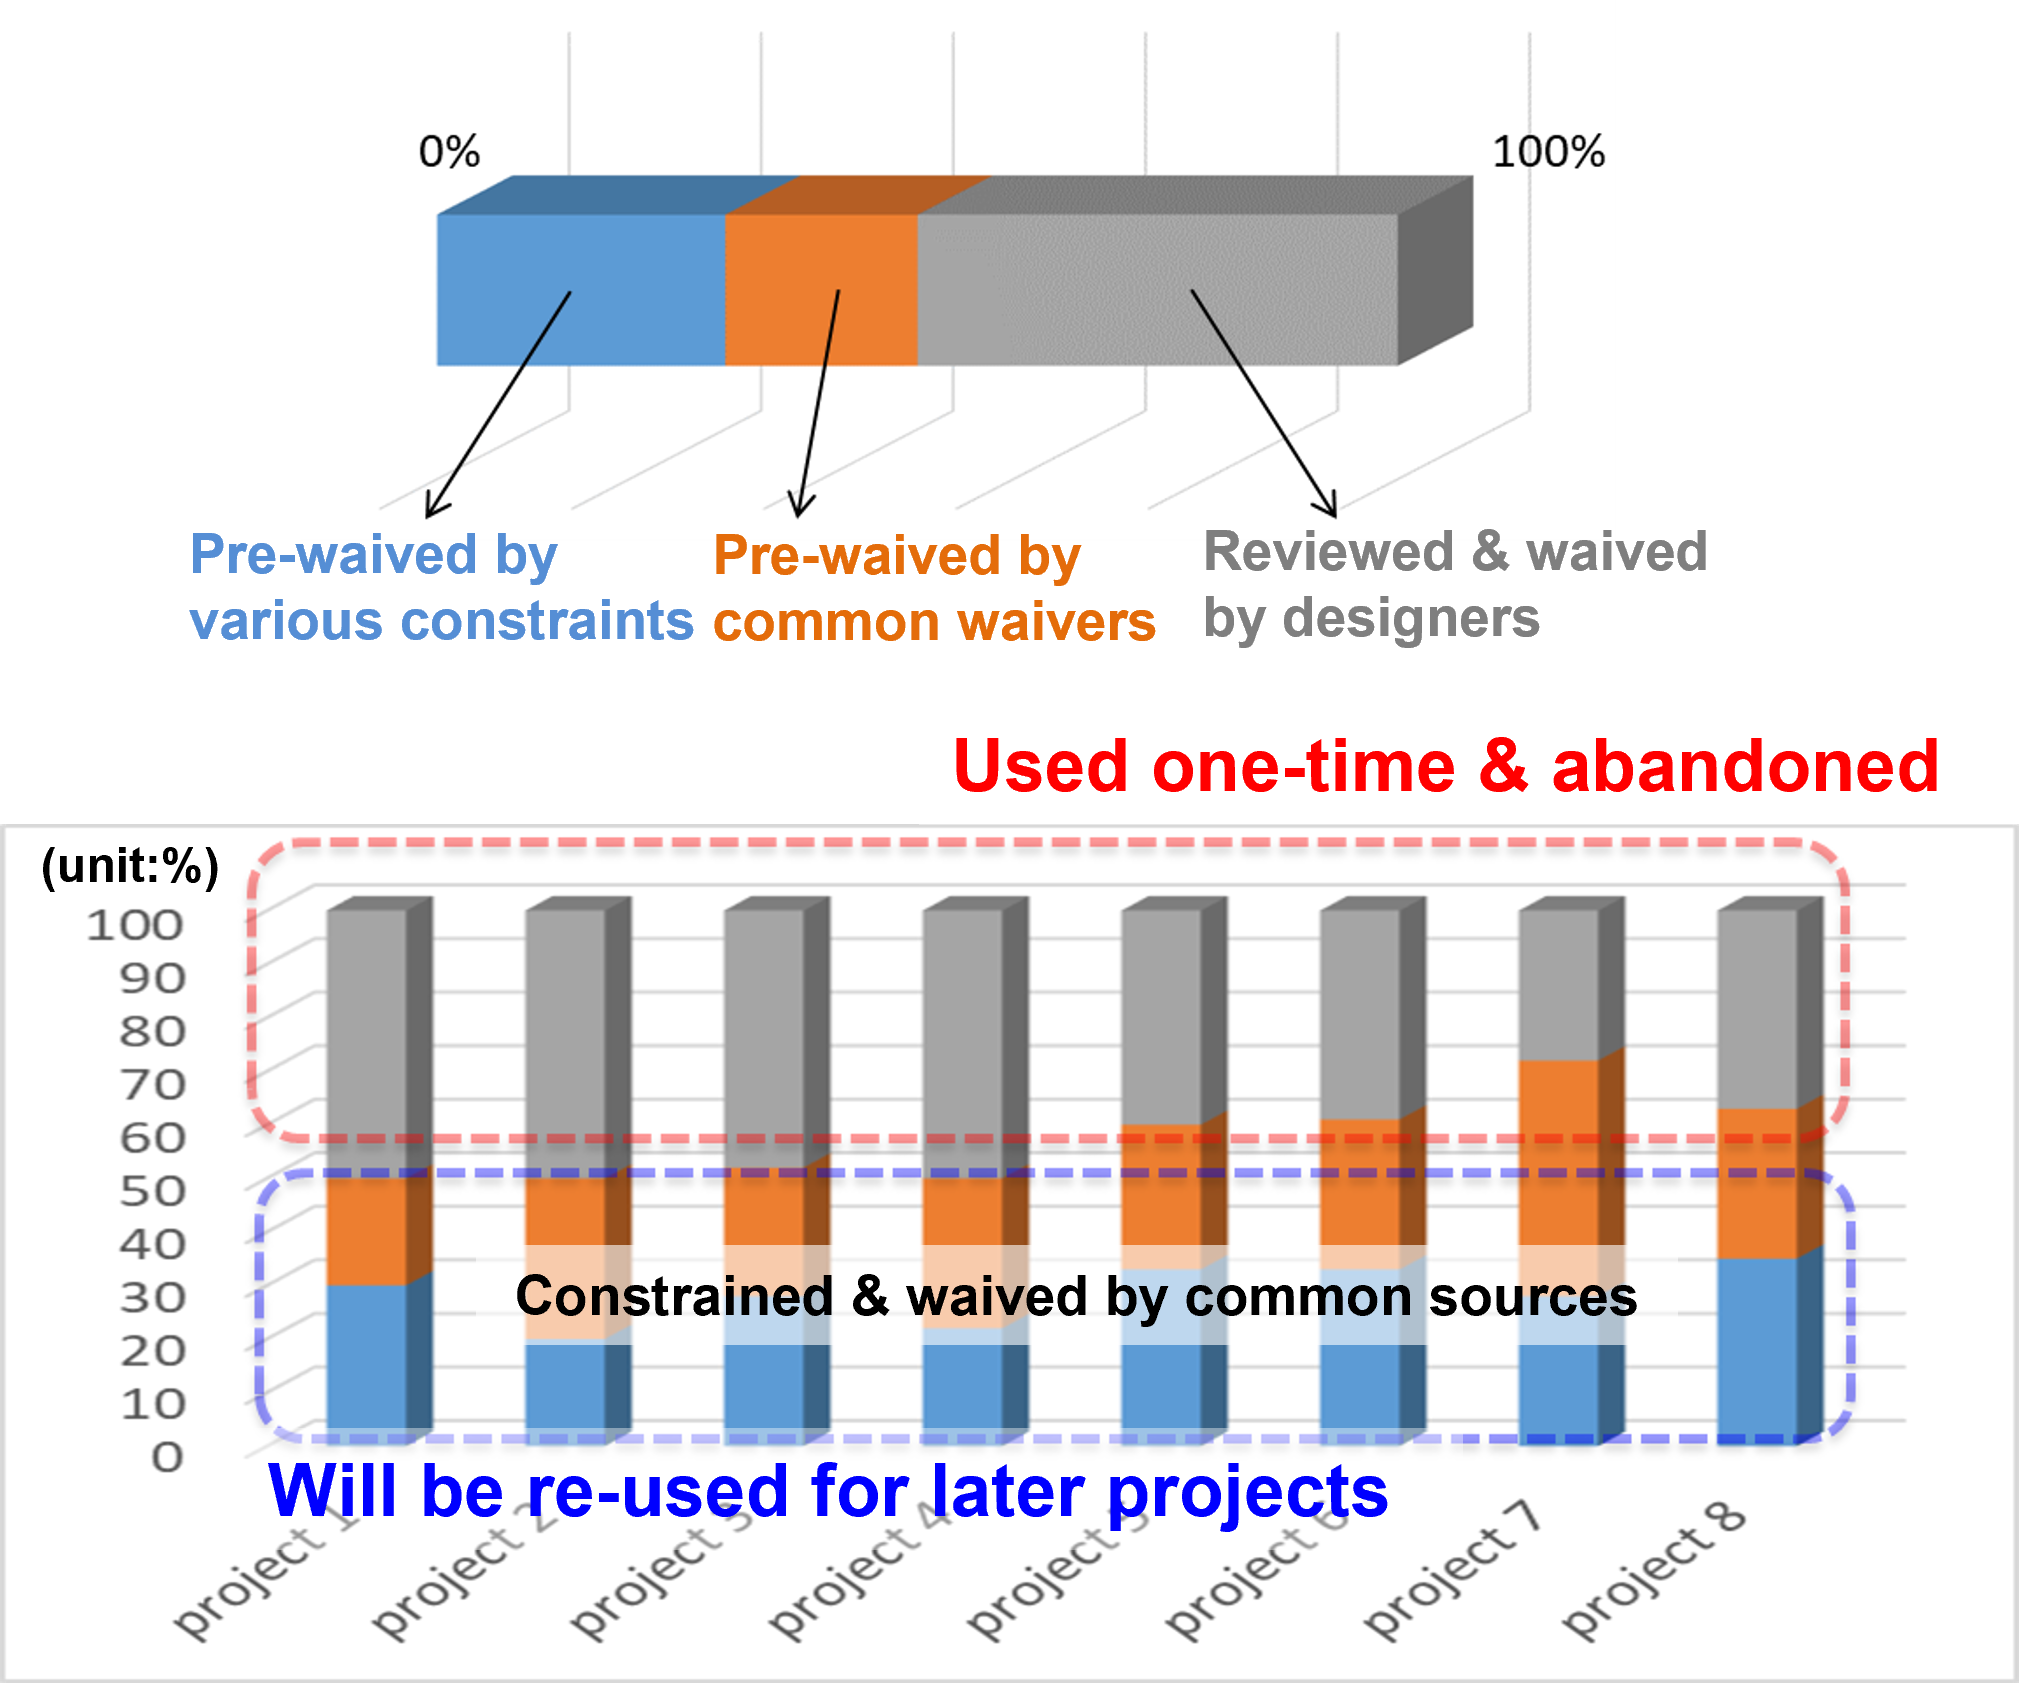
Overall CDC paths & corresponding waivers
After investigating how our SoC team was handling the clock domain crossing violation waivers and constraints, we found that half of the waivers are common, meaning they are used again across new projects. However, half of the waivers are only used once.
This is the background context for our machine learning-based CDC experiment.
Basic Premises for Samsung’s New Approach
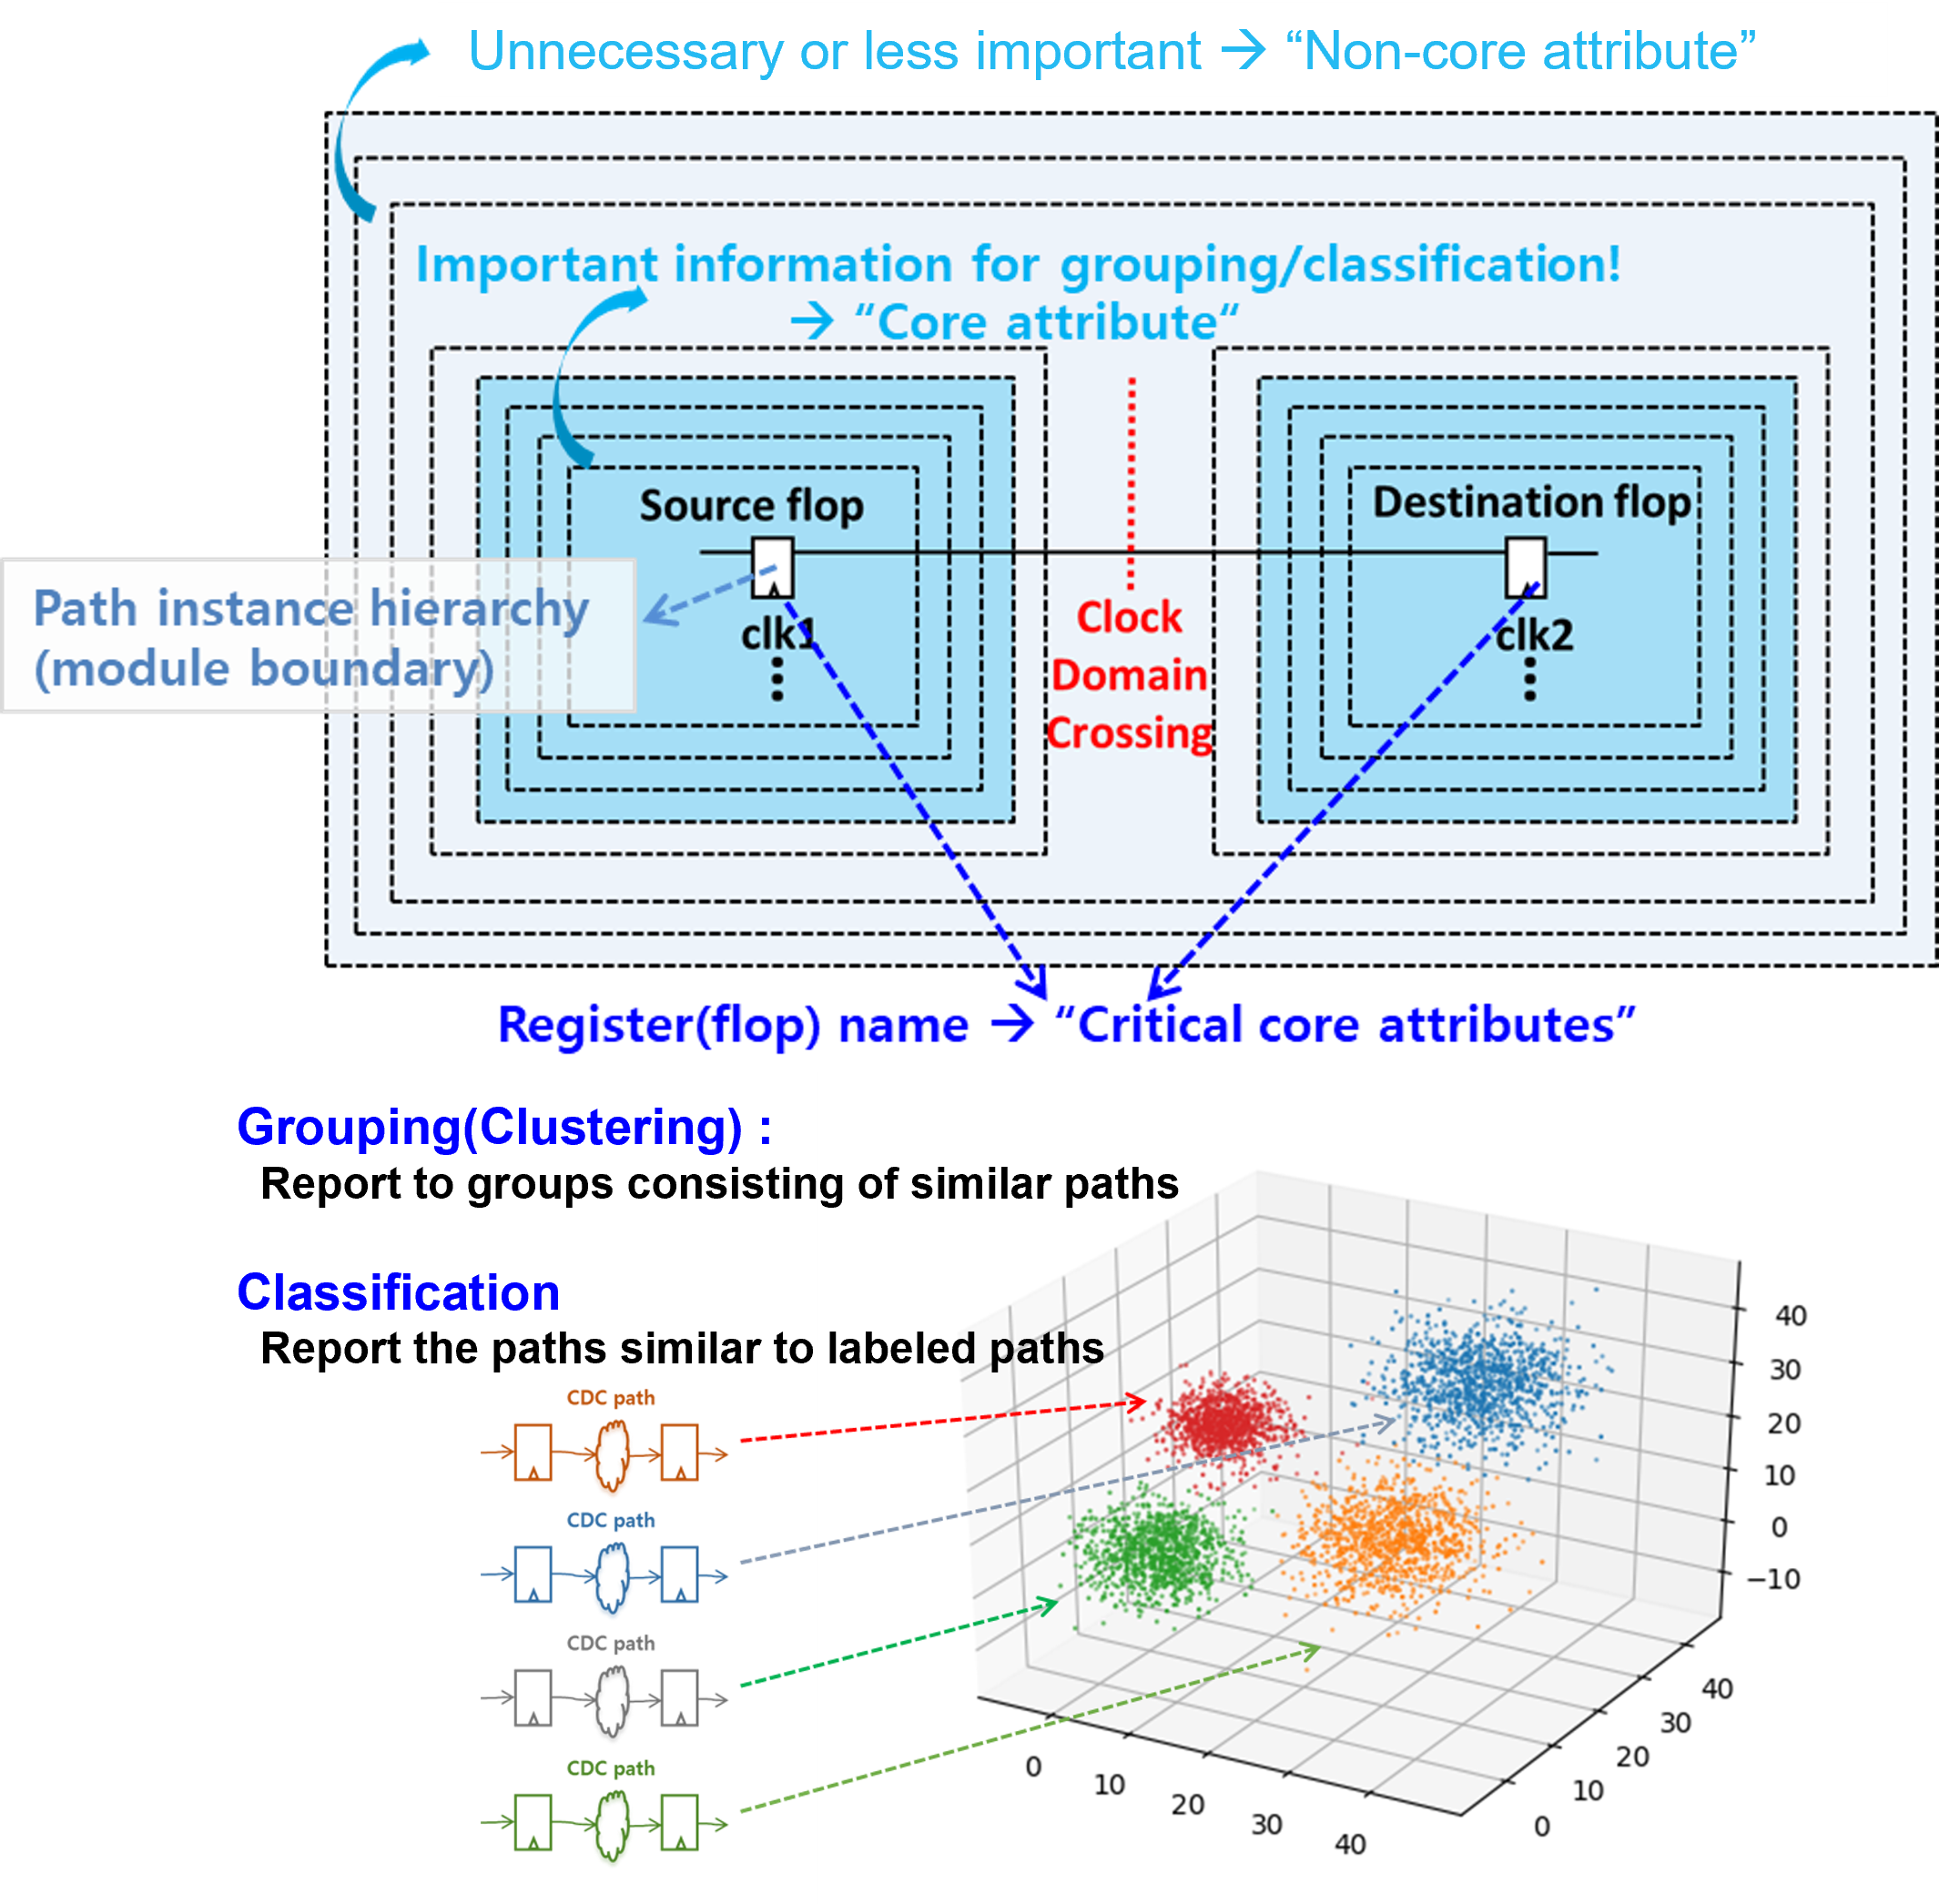
CDC path analysis characteristics
Clock domain crossing path analysis is basically register-to-register path analysis. One challenge we have is that there are always repetitions of the same or similar tests in the design. This is due to the fact that multiple instantiations of the same IP components are used across a variety of projects.
Further, our designs have a tremendous number of CDC paths. We have roughly 40 blocks in the physical design unit; our CDC static sign-off reports have a lot of violation ‘noise’ to analyze.
Reducing debug effort
It is well understood that analyzing CDC violations can be eased by efficient sorting and grouping similar items.
Further, in some cases, our previous CDC sign-off history can give us useful information on the new reports for new designs.
Machine Learning (ML) techniques expected to fit
After investigation machine learning technology, we concluded that machine learning techniques should be able to help with our CDC static sign-off.
There is abundant CDC data in the design; additionally, machine learning is used is used for clustering (grouping) and classification, which is very similar to how we do CDC analysis. Finally, the CDC data can be digitized and vectorized to be used by a machine learning system.
Our fundamental goal is to make use of machine learning for clustering and classification, to help our engineers reuse waivers from pervious project.
Machine Learning Model Implementation
Pre-processing CDC attributes
This section describes our machine learning model implementation with Real Intent Meridian CDC.
The blue box is for the system for training. We train the model from a past project. This red box is for the application after training. The training system will deliver optimized parameters to this application; so, if there is a new project, the data will go into this system and flows.
The system contains pre-processing because we must change the CDC data into a numerical form for the machine learning can understand it. The pre-processing unit is a feature extension. We add some weighting for core attributes and non-core attributes
ML model components
The system contains a classification unit and a clustering unit. The same data is used for the analysis.
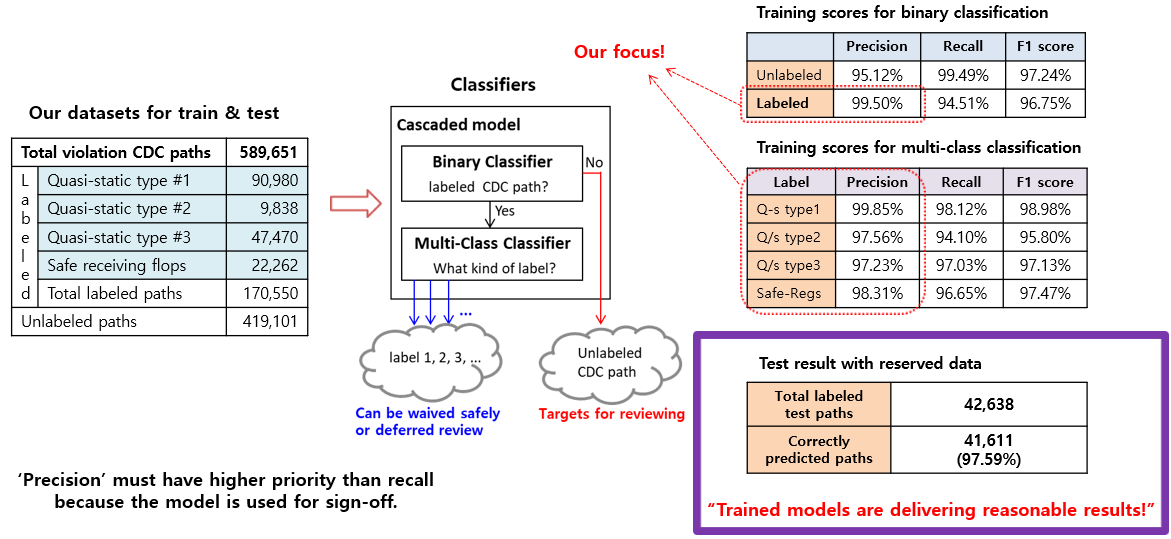
The classification unit uses a cascading model. One is a binary classifier followed by multi-class classifier.
- The binary classifier will identify whether or not the data is labeled.
- Next, the multi-class classifier tells us if the data belongs to a defined category.
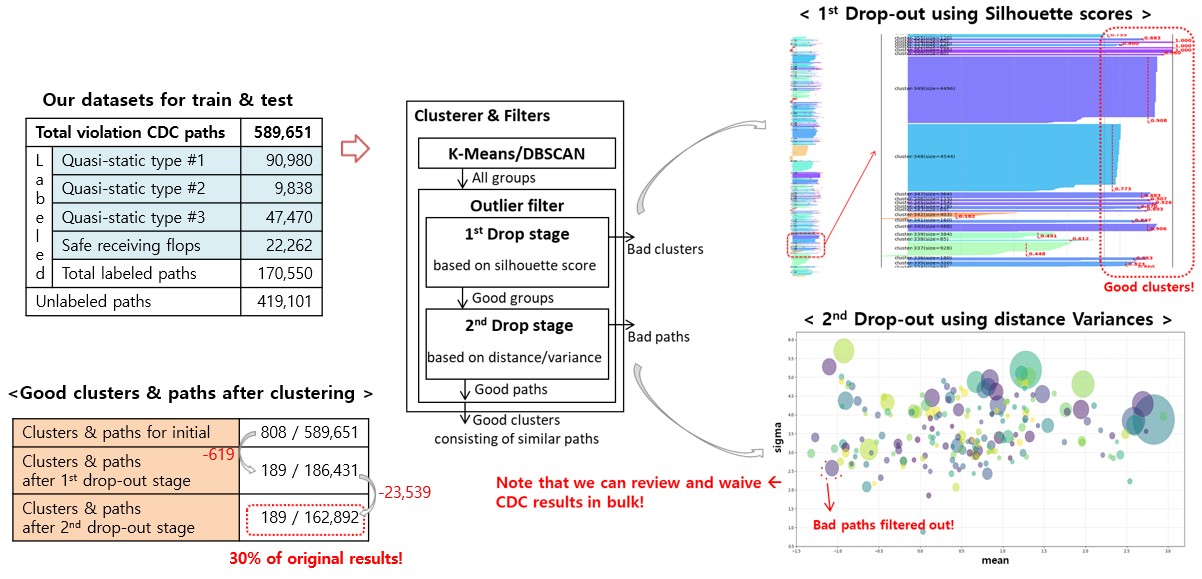
We also implemented the clustering unit. The DBSCAN algorithm gave the best result, plus we have two dropout filter layers, to filter out the bad cluster out and bad paths.
- The first dropout is for singling out bad clusters, using a silhouette score. The role of clustering is to gather similar paths in bulk so it will ease and reduce our debugging effort.
- The second dropout removes the bad data, using the distance from the center and its standard deviation. If a path belongs to this group but is far from the center, then we exclude that path from our analysis.

click to enlarge
One of the outputs for classification is unclassified data. We focus on those with higher priority because machine learning remembers we have seen those paths before.
Results – CDC Classification using Machine Learning
We used four premium SOC projects to evaluate our machine-learning based CDC analysis.
We gathered the CDC paths and intentionally added some labels to evaluate the classification. We labeled about 30 percent — the rest were unlabeled.
We put this data into the classifier and it makes a decision. If we’ve seen the data before, it goes into the bulk classifier; if not, it will go to the unlabeled category.
The labeled violations can be waived easily because the machine learning system remembers them, so we can put the lower priority on them. The unlabeled and unclassified paths will be the main target for our review.
The table on the right shows the evaluation scores during training, for the final test. Both delivered roughly 97 to 99 percent.
This means our system is delivering reasonable results. We focused on the precision (over recall) because we want to use this for sign-off, so we have strict criteria to ensure it is highly reliable.
click to enlarge
Results – CDC Clustering using Machine Learning
The clustering results are based on the same dataset as was used for classification; note that we didn’t need labels for clustering.
Initially the clustering model reported roughly 800 clusters and paths; this was not a very good result. Then, the first dropout stage filtered out 600 clusters, based on bad scores, excluding them from the analysis; the good clusters, with high silhouette scores, were retained.
The second dropout stage excluded more data based on distance from the center.
The end result for our machine learning-based CDC clustering was that roughly 30 percent of the original data was considered to be good clusters. This result will greatly help our engineers save time on waiver review by reviewing and waiving in bulk.
click to enlarge
Conclusion: Machine Learning-Based CDC Classification & Clustering
Our result was that the machine learning models were able to do CDC classifications and clustering — very similar to CDC analysis.
To successfully deploy machine learning technology, we needed a lot of data; we can improve the model even further if we maintain and manage the volume of the data and the quality of data, such as using labels.