iDebug – Intent-Driven Debug Environment
Design Intent Debug and Data Management
iDebug for Real Intent’s products is an intent-driven debug environment for its suite of products for the verification of digital designs. iDebug provides an intuitive debugging experience that is universal across all Real Intent tools. It employs a database for the intelligent hierarchical analysis of design intent. It includes an integrated visualization capability, iVision, that provides design source browser, schematic and waveform visualization. The intent analyses of iDebug distinguish the root cause of issues, and minimize iterations and debug time, enabling powerful sign-off mechanisms.

Features
- Database based debug
- Graphical user interface (GUI) as well as a command-line interface (CLI)
- Interactive debug
- Sorting and customizing result presentation
- Filter results using the ViewCriteria
- Setup and apply waivers
- iVision integrated visualization
Full Intent Database Captures All Phases of Verification
iDebug uses database (DB) driven debug for managing the intent analysis of a design to achieve sign-off.
For sign-off products, such as CDC, each phase of analysis is supported. The setup database contains all the environment information needed to debug the design. As the user debugs and revises the setup, the information is stored in the database. After the structural analysis, the database contains the results of the analysis that can be viewed in the GUI or through text reports. Final sign-off debug with the formal analysis completes the intended debug flow.
For functional verification products, such as Lint and AutoFormal, iDebug provides interactive debug of each of the report categories and supports a full causality analysis of design errors.
Intelligent and User-Configurable Sign-Off
iDebug reads and stores information using a database, rather than from text-based information. This offers significant flexibility in analyzing and rerunning the analysis. iDebug offers both a graphical user interface (GUI) and a Tcl-based-command-line interface (CLI) that offers both interactive and batch modes. The debugging state is interactive. Users can set the status of an individual check failure within the iDebug environment. The state is saved across multiple debugging sessions. Check results can be sorted across any desired columns of information. iDebug introduces spreadsheet-like column sorting for rapidly organizing data according to the desired criteria.
Results can be viewed using rule policies in the iDebug environment and the CLI, thus providing a rich set of functions for interactive and filtered debugging. Perform results filtering using the ViewCriteria, specifying check criteria of interest and returning subsets of the overall database that match the stated conditions. Users can save and reuse these view criteria, and can set up and apply waivers in tools.
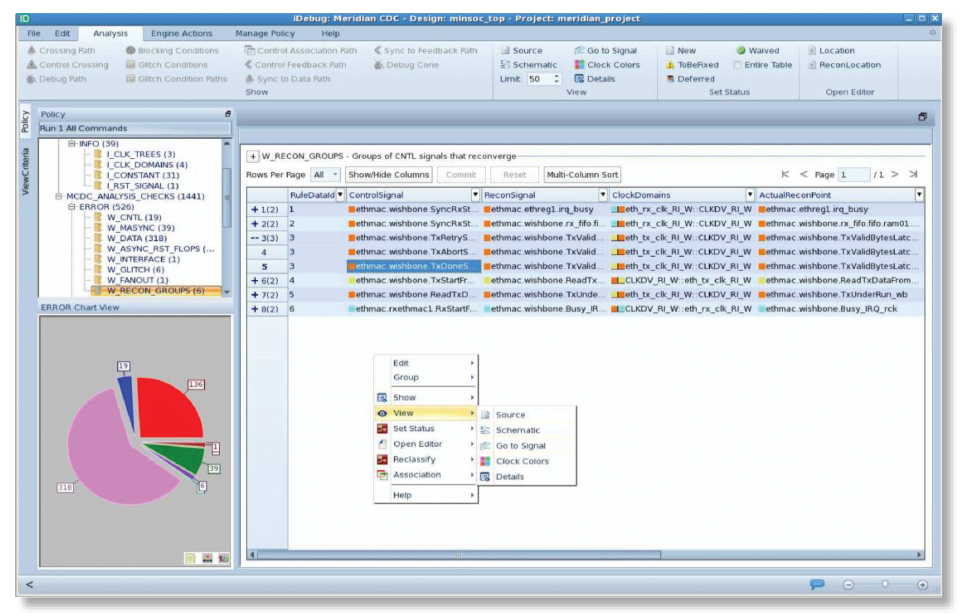
State of the art debug environment (Click to enlarge)
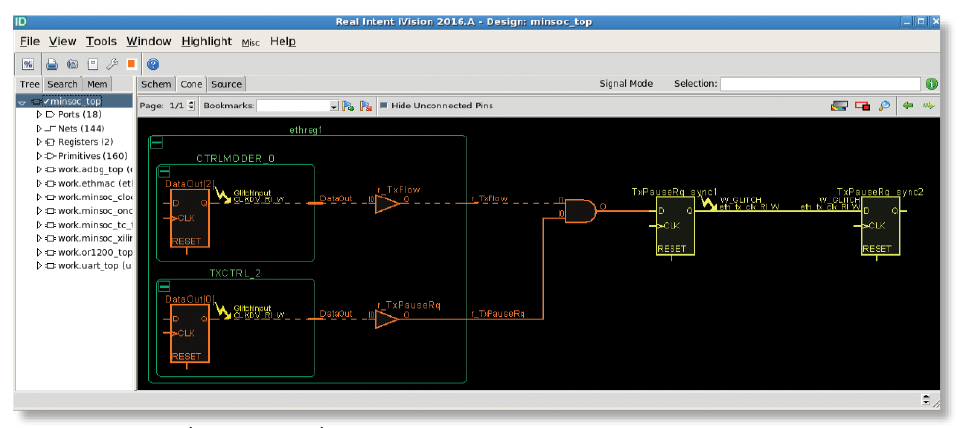
iVision schematic visualization (Click to enlarge)
iVision Integrated Visualization
iVision provides fast visualization of RTL, so that users can easily understand and implement existing code elements, whether in VHDL, Verilog, or System Verilog.
The integrated iVision visualization capability enables users to browse source code relevant to violations. It also includes an easy-to-navigate schematics view to debug specific violations.
For some of the violations related to functional issues, the integrated waveform viewing provides additional insight to the root-cause of the problems.