Ascent AutoFormal – Automatic Formal Linting
Automatic Formal Linting Reduces Simulation Effort
Ascent AutoFormal, a multimillion gate capacity formal linting tool, identifies RTL design bugs using formal sequential analysis, expanding on Ascent Lint‘s syntax, semantic, and style checks. AutoFormal formal linting tool is complementary to other forms of design specification verification, including simulation.
The tool provides early functional verification to automatically uncover deep, fundamental bugs in RTL code. It finds RTL bugs early in the design flow, before your test benches are available, getting your RTL code ready for simulation.
This early expanded functional verification makes your debug easier, eliminating lengthy, costly chip-level simulation cycles. Debugging with AutoFormal is easy, with links to the integrated source browser, VCD viewer, the schematic viewer, and the FSM viewer.
Minimal effort is required for fast, accurate results. Ascent AutoFormal executes the following steps:
- Extracts checks based on implied intent of the RTL
- Automatically sets up design environment factors, such as clocks, reset & configuration constants
- Runs formal analysis to detect violations, utilizing multiple engines to find sequential bugs quickly
- Determines root cause errors
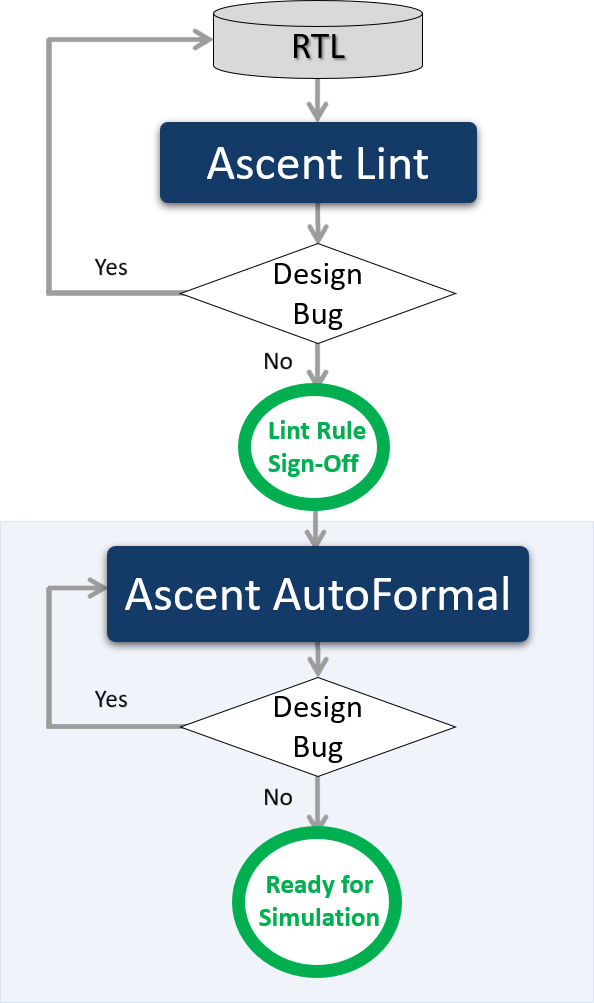
2-Step Early Functional Verification with Ascent Lint & Ascent AutoFormal
What is Formal Linting?
Formal linting uses formal verification technologies to automatically check for functional bugs associated with sequential control logic, including FSM deadlocks, coverage checks, & range violations. Formal linting generally occurs before simulation, reducing debug effort by finding elusive control logic errors early.
Multi-Million Gate Capacity & 10X+ Performance Speedup
Our new array of engines can deliver more than a 10X performance speedup over prior versions. We’ve introduced faster engines, plus we now support the automatic splitting of runs across parallel cores, for a 2-4x speedup with a nominal 8 cores.
Ascent AutoFormal now has the speed and capacity to easily handle design blocks with millions of gates.

Single core sequential
5-10x speedup

8 parallel CPU cores
2-4x speedup
To maximize bug hunting, the best engine is automatically applied based on the type of check being performed.
Benchmark: A 7M gate design completed in only 11 hours.
The new engines dynamically determine whether or not the analysis is converging for a particular check, moving on to a new check when necessary. The result is an extremely high completion rate.
Benchmark: A 3M gate design completed 4 hours, that previously ran 96 hours and did not finish.
The completed checks give you full confidence that any bug associated with a particular check has been identified, reducing your follow-on simulation effort.
Additionally, the tool will resume analysis after a prior verification run, efficiently extending the original analysis, saving valuable analysis time and avoiding unnecessary iterations.
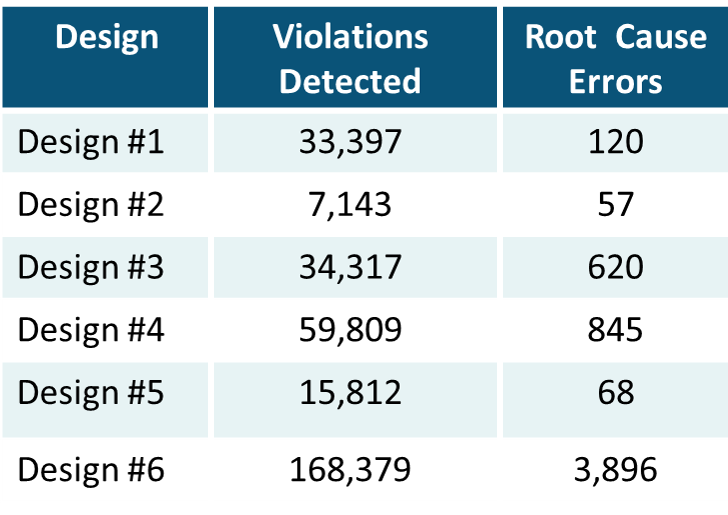
Root Cause Analysis Minimizes Debug
The hierarchical formal linting analysis in Ascent AutoFormal uncovers the root cause of bugs deep in the design. These bugs often propagate to higher levels — and can be missed in simulation.
Ascent AutoFormal’s algorithms determine and distinguish:
- Root Cause errors
- Secondary violations due to the propagation of the root cause errors
- Duplicate errors from multiple instances
- Structural violations that can be caught by a linter & do not require sequential analysis
The separate classifications better focus your debug effort.
Ascent Autoformal Resources
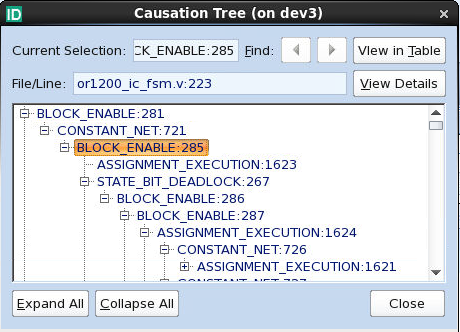
Violation Causation Tree shows Root Cause Extended Impact
One simple typo in the RTL code can propagate to cause a ripple effect of errors. In a simulation, you would observe incorrect functionality at the outputs; it could then potentially take you multiple iterations to trace back to figure out the root cause.
AutoFormal’s violation causation tree clearly identifies the root cause errors and their descendants, saving you debug time.
The example shown is of a block enable root cause and its descendants. The block could not be entered because the conditional expression could not be true.
Thus the assignments in that block would never happen, causing dead code and constant nets. The constant nets in turn resulted in assignments not being about to take both a 1’b0 and 1’b1 value, which in turn caused other conditional blocks to not be able to be entered.
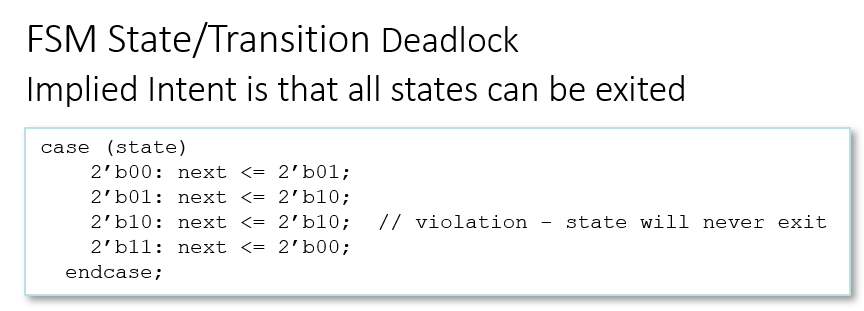
Formal Linting — Implied Intent Check Generation
The Ascent AutoFormal formal linter performs an analysis of each of the design elements in the RTL code, and then automatically generates functional assertions that are based on the implied intent.
This automatic check generation eliminates the need for designers to learn an assertion language and manually create potentially 1000s of assertions. This automation saves designers extensive effort in thinking of all scenarios to be tested, which would not be feasible with project deadlines.
Implied Intent Check Examples
FSM deadlocks and unreachable state checks verify critical aspects of control logic that simulators may miss. Additionally, transition checks facilitate debug and ensure that the checks are comprehensive by identifying deadlocks that are dependent on how the state is entered.
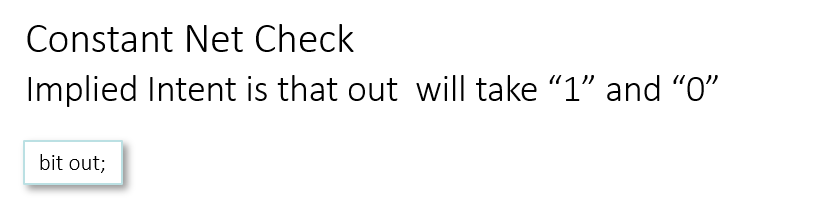
Identify coverage issues such as constant nets, constant RTL expressions & constant state vector bits.
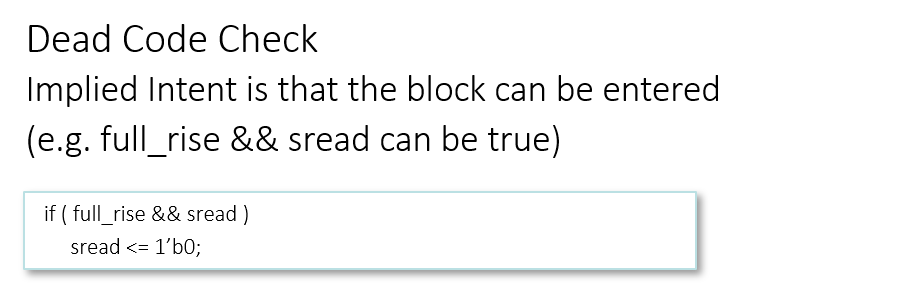
Dead code checks find code that cannot be executed, such as blocks are never enabled.
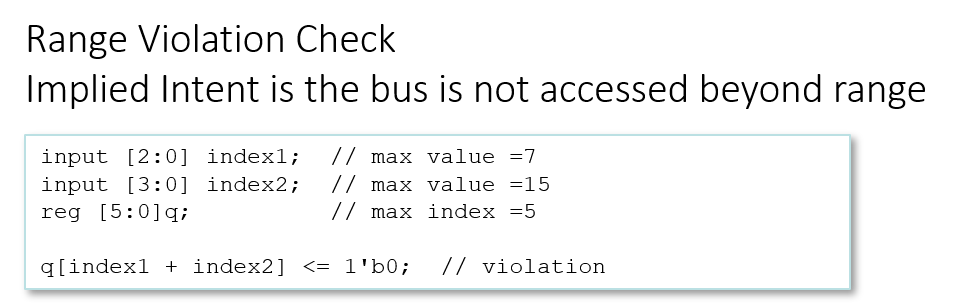
Array bounds violations detect hard to debug in simulation issues that will likely impact functionality.
Significant signals and constructs recognized during check creation are provided even before the formal engines are called. For example, clocks, resets, FSM state details, enumeration details, latches, undriven nets, and non-resettable flops.
Additional Setup checks alert the user when there are clocks or resets that could not be determined automatically, or combo loops that would prevent formal analysis.
Integrated Debug Environment
Ascent AutoFormal comes with iDebug, Real Intent’s unified integrated graphical debugger. Debugging with AutoFormal is easy, with links to the integrated source browser, VCD viewer, the schematic viewer, and the FSM Viewer.
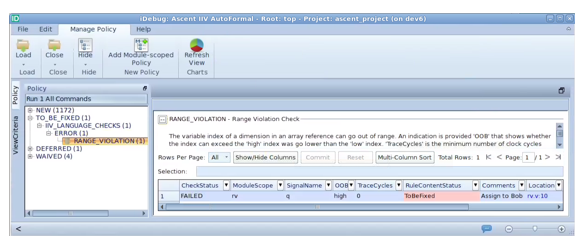
Violation information to help with debug is also provided, such as detailed check descriptions. For example, a range violation check will show whether the violation is out of bounds in the high or low direction. Checks related to a conditional RTL construct will identify the conditional type.
In addition to enabling debug, iDebug also tracks status and user provided comments. Four statuses are available – NEW, TO_BE_FIXED, DEFERRED, and WAIVED. Comments can also be added. The status and comments are written to the results database, and can be ported across runs.
iDebug also supports targeted re-invoke operations that enable running a subset of checks to verify RTL fixes.
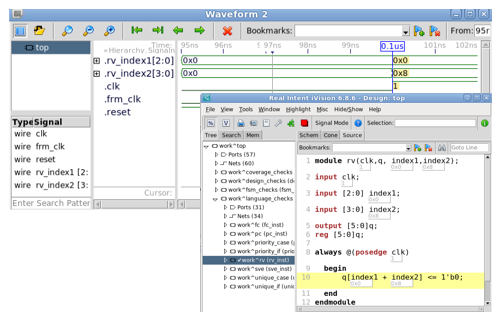
VCD Traces show Sequence of Events
Automatic VCD traces show the sequence of events leading to an undesired condition. The traces also shows the time of failure.
VCD values from the selected time on the waveform are annotated to the source browser, making it easy to see the RTL execution flow.
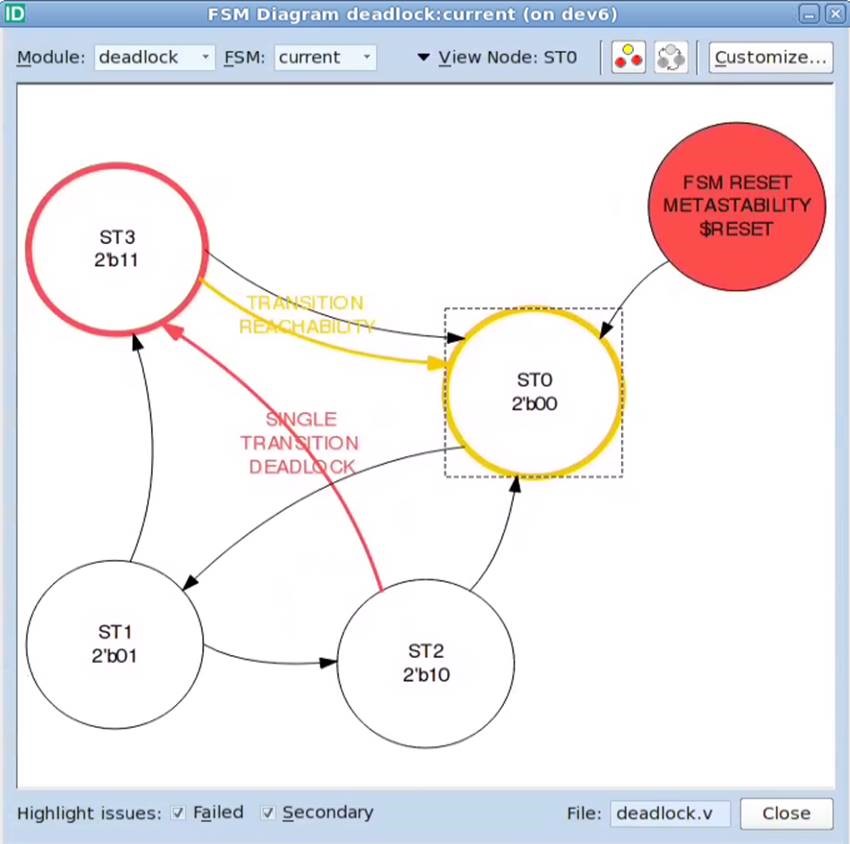
Integrated FSM viewer
The integrated FSM viewer improves efficiency in debugging your FSM violations. With custom viewing options, you can see the entire FSM flow, or focus on specific areas of interest.
Root cause errors are distinguished from secondary issues.
The FSM viewer contains bidirectional links between the FSM violations and the FSM violation data table.
You can also link to the source or schematic viewer from any state or state transition on the FSM diagram.
What Ascent AutoFormal Users are Saying
Time Savings

“Ascent AutoFormal enabled a 30 percent reduction in logic simulation time.
“This simulation reduction was based on AutoFormal’s ability to identify the root cause error as a primary failure, with other violations detected as warnings. We were able to quickly and precisely eliminate bugs during the early design phase.”
– Atsunori Machida, Fujitsu Kyushu Network Technologies, Case Study
Fast
![]()
“Real Intent Ascent AutoFormal is really fast – we can run 100K gates in minutes. It’s quick to set up – under an hour. And it only takes a day or so to learn to use it. Our designers typically run Ascent Lint first, then AutoFormal, then simulation.
“AutoFormal is simple and powerful, and its root cause report really helps you to pinpoint areas of interest.”
– Semiconductor Designer, DeepChip.com EDA tool report
Precision, Low Noise
![]()
“The smart reporting of Ascent AutoFormal greatly reduced the size of analysis results compared to other tools and provided equal or better accuracy of results.
“These advanced debugging capabilities help our designers debug in a short amount of time, and reduce design errors and turnaround time for our product development.”
– Katsuhisa Ikeuchi, NEC